Data Analysis Series V: Some analysis using world top income data by pandas
2016-05-31
Today, I want to show you how to do data analysis using real data by pandas.
This process is from the book of practical data science cookbook.
In that book, it use the package numpy and matplotlib to do some data transformation and visualization.
The code is much long and difficult to understand.
So, I rewrite the code use pandas which is also a package in Python.
The codes and figures are all in here.
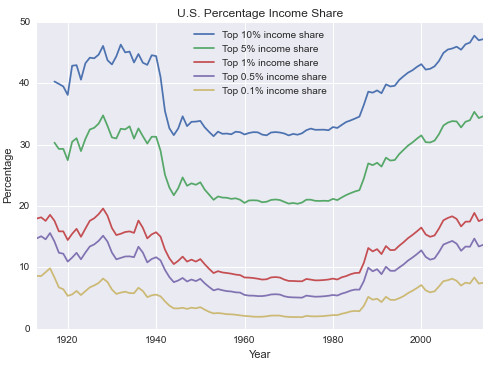
Such as this graph:
Referenced:
- Practical Data Science Cookbook
Welcome your advice and suggestion!
Just record, this article was posted at linkedin, and have 22 views to November 2021.